SVG charting library to display daily graph of a stock market security – Dailychart.js
Dailychart.js is a tiny standalone SVG charting library written in javascript to display daily graph of a stock market security.
Install plugin via NPM
npm install dailychart
Libraries
Include the library
var Dailychart = require('dailychart');
of include the file
HTML
Create a placeholder element for the stock chart and specify the data using the following data attributes:
- data-dailychart-values: points
- data-dailychart-close: the close value of the previous trading session
- data-dailychart-length: the number of points in the trading session
CSS
#chart {
  width: 80px;
  height: 30px;
}
javascript
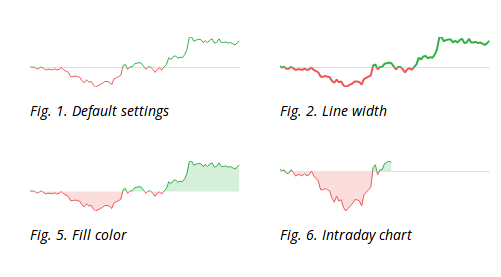
Initialize the stock chart with default settings.
ar el = document.getElementById('chart');
new Dailychart(el, [options]);
You can also use list options to customize the plugins:
width– Chart width. If not set it equals to container’s width.height– Chart height. If not set it equals to container’s height.lineWidth– Line width of the graph (default: 1).colorPositive– Color of the positive part of the graph (default: ‘#33AE45’).colorNegative– Color of the negative part of the graph (default: ‘#EB5757’).fillPositive– Fill color of the positive area (default: ”).fillNegative– Fill color of the negative area (default: ”).closeWidth– Width of the close line (default: 1).closeColor– Color of the close line (default: ‘#e0e0e0’).
See live demo and download source code.
DEMO | DOWNLOAD
This awesome script developed by dailychart, Visit their official github repository for more information and follow for future updates.