Create Beautiful Javascript Charts using ApexCharts Plugin
Do you want to add chats on your website to display graphical presentation of reports/sales/order/marketing If yes then in this post I am going to share awesome jQuery library which help you to create different different chats for your reports as per need. apexcharts.js is a feature-rich JavaScript chart library lets you create dynamic, interactive, responsive, animated, SVG-based LINE, AREA, COLUMN/BAR, MIXED, BUBBLE, SCATTER, PIE, RADIALBAR, HEATMAP, GAUGE charts and graphs to visualize your complex data.
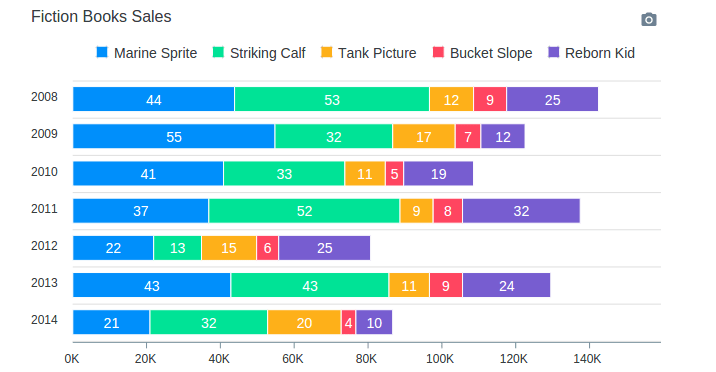
Integrate jQuery ApexCharts Plugin to create Charts
Libraries
You only need to add apexcharts minified javascript library on page.
HTML
Create simple HTML container where chart will display.
JS
After loading all the files, you are ready to build your first chart. To create a chart with minimal configuration, write as follows
var options = {
  chart: {
    type: 'line'
  },
  series: [{
    name: 'sales',
    data: [30,40,35,50,49,60,70,91,125]
  }],
  xaxis: {
    categories: [1991,1992,1993,1994,1995,1996,1997, 1998,1999]
  }
}

var chart = new ApexCharts(document.querySelector("#chart"), options);

chart.render();
See live demo and download source code.
DEMO | ALL DEMOS | DOWNLOAD
This awesome jQuery plugin is developed by apexcharts. Visit their official github repository for more information and follow for future updates.